Purpose of Instrumentation
Instrumentation for Node.js holds two purposes. The first is to give users detailed information about what happens on their server. The more things instrumented, the more detailed this graph can be.
[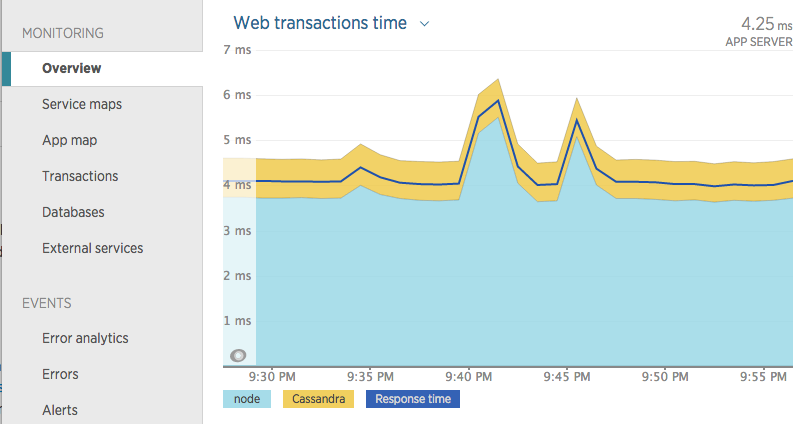 ]
]
The second purpose is to maintain the transaction context. In order to properly associate chunks of work with the correct transactions we must link the context through asynchronous boundaries. This is a broad topic that is discussed in more details in this separate tutorial Transaction State Preservation.
Adding Custom Instrumentation to the New Relic Agent
Calling require('newrelic') will return an API object, which contains the following methods for registering custom instrumentation:
- instrument
- instrumentDatastore
- instrumentWebframework
- instrumentMessages
These methods are used to tell the New Relic agent to use the provided instrumentation function when the specified module is loaded by Node. It is critically important that we register our instrumentation before the module is loaded anywhere. For example:
var newrelic = require('newrelic')
newrelic.instrument('my-module', instrumentMyModule)
var myModule = require('my-module')
All four methods have the same signature. The difference between them is in what type of shim they provide when the instrumentation function is called. The instrument method provides only the base shim Shim, while instrumentDatastore, instrumentWebframework, and instrumentMessages provide shims specific to the type of instrumentation (DatastoreShim, WebFrameworkShim, and MessageShim respectively).
The instrument call could have also been written using named parameters like this:
newrelic.instrument({
  moduleName: 'my-module',
  onRequire: instrumentMyModule
})
This call is equivalent to the first one, it just depends on your preferred style.
Handling Errors
While debugging your instrumentation it can be useful to get a handle on any errors happening within it. Normally, the agent swallows errors and disables the instrumentation. In order to get the error for your debugging purposes you can provide a third argument to instrument that receives the error.
newrelic.instrument({
  moduleName: 'my-module',
  onRequire: instrumentMyCustomModule,
  onError: function myErrorHandler(err) {
    // Uh oh! Our instrumentation failed, lets see why:
    console.error(err.message, err.stack)

    // Let's kill the application when debugging so we don't miss it.
    process.exit(-1)
  }
})
Questions?
We have an extensive help site as well as documentation. If you can't find your answers there, please drop us a line on the community forum.